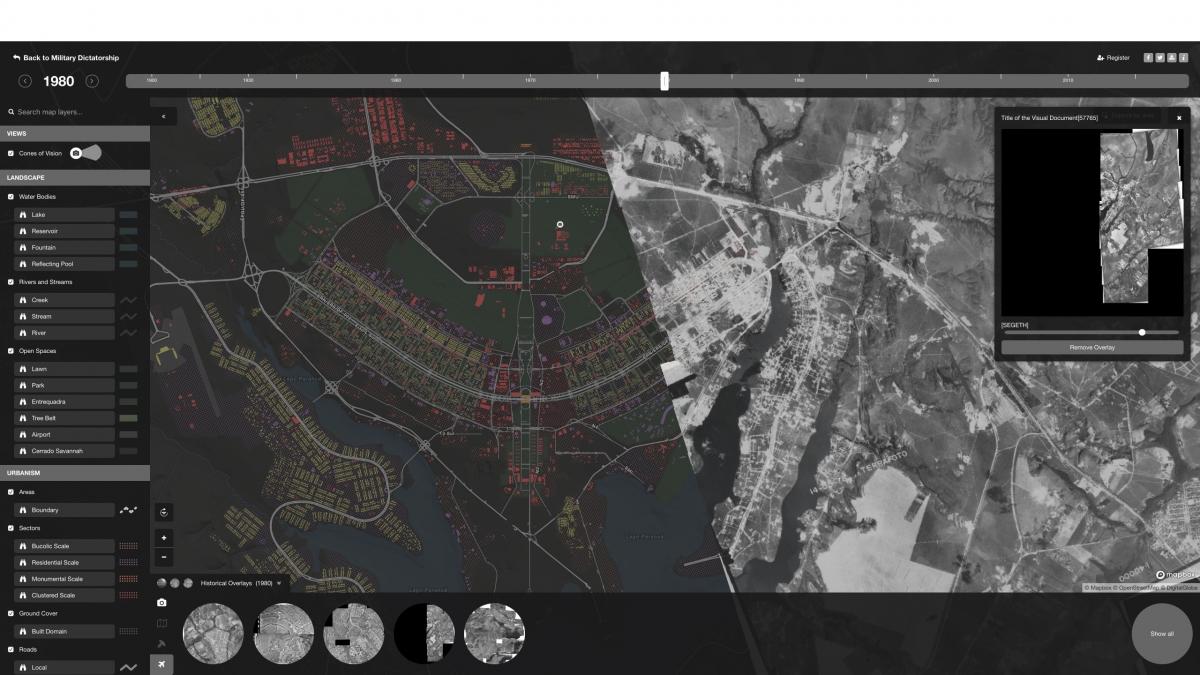
First place - pilotPlan: A Temporal Map of Brasilia
by Farès el-Dahdah, Professor, and GIS Specialists: Bruno de Castro Sousa, Uilvim Ettore, and Ualas Rohrer (Humanities Research Center - Rice University)
pilotPlan is an online mapping platform that illustrates the urban evolution of Brasilia, over its entire prehistory, history, and possible futures. Primary sources, such as views, maps, architectural plans, and hyperspectral imagery are located in time and space while their associated visual and geographic data are integrated across a number of databases (including an open-access digital library of images, a geographic information system, an open source relational database, and a content delivery web service).
More information about this project can be found here.
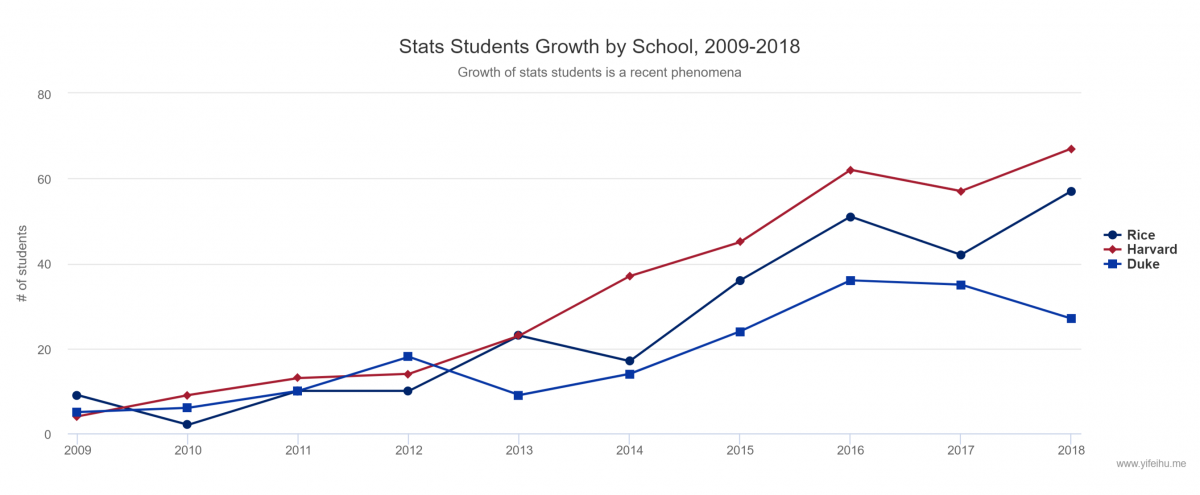
Second Place - Statistics on Statistics Students
by Yifei Hu, undergrad student, Statistics
Every year, the Statistics Departments at Rice, Harvard and Duke publish lists of recent undergraduate alumni who studied statistics. Data was collected about these alumni who graduated in 2018 through online research in the hopes of discovering interesting insights about the statistics students at these schools. More information about this project can be found here.
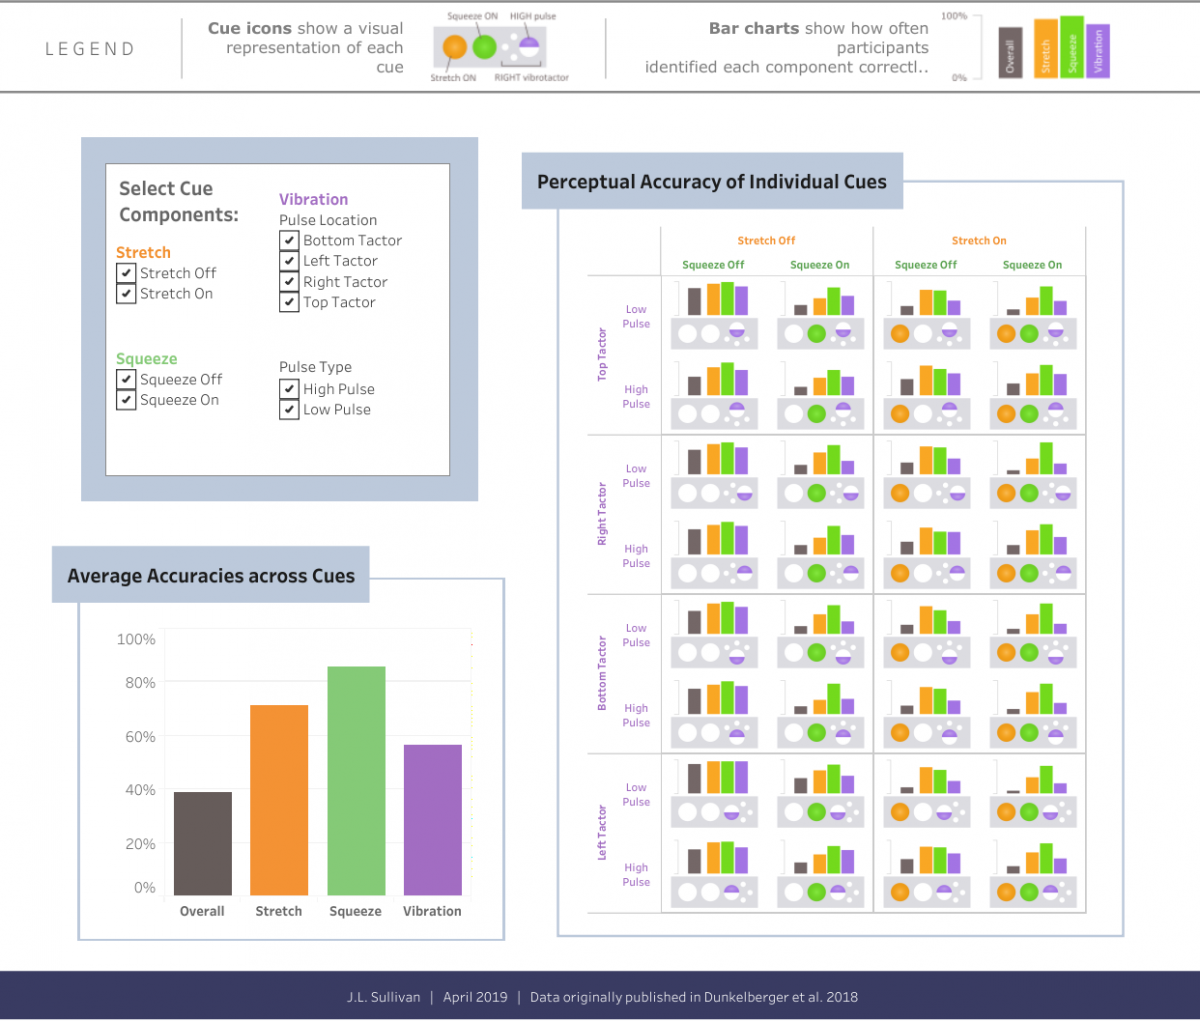
Third Place - Perceptual Accuracy of Complex Tactile Cues
by Jenny Sullivan, Research Program Manager in MECH
This submission is an interactive data visualization based on an experiment we conducted to evaluate how accurately people can perceive complex tactile sensations. Although extensive research has been done on the perception of vibration, relatively few studies have investigated how we perceive other tactile sensations, such as skin stretch or squeeze, especially when multiple tactile sensations are rendered concurrently. Using a set of 32 tactile cues combining vibration, stretch, and squeeze sensations, we performed a user study in which participants were asked to identify the 3 component stimuli after each cue was rendered on their upper arm. More information about this project can be found here.